ajax loader

Loading...


Ride-the-Wave Strategy – Best for Stock Traders

Ride-the-Wave targets multi-day price momentum following a company’s earnings announcement (EA). With this strategy:

  1. Buy a stock one day post-EA if a stock reacts positively post-earnings:
    1. Near the close of trading the EA-day for a pre-market-EA
    2. Near the close of the following day for a post-market-EA
  2. Sell-to-close after 7-10 days, or possibly earlier if a desired price target is reached

Similarly,

  1. short a stock one day post-EA if a stock reacts negatively post-earnings:
    1. near the close of trading the EA-day for a premarket-EA
    2. near the close of the following day for a post-market-EA
  2. then buy-to-close after 7-10 days, or possibly earlier if a desired price target is reached

Important: Ride-the-Wave is predicated on significant price momentum triggered by an EA. The 7-10 day scenario is the maximum trade hold-time. If you see post EA-momentum is halted or reversed by a significant opposite move, re-evaluate your presence in the trade.

This popular StockEarnings screen below will give you a list of stocks that historically exhibit significant price momentum following an EA for the next seven days:

  1. Stocks exhibiting positive post-EA price moves are buy-candidates
  2. Stocks exhibiting negative post-EA price moves are sell/short-candidates

The screen includes those stocks whose Earnings just came out in last two days.

Screen criteria:

  1. Earnings Date Start Date : Current Date + -1 Day
  2. Earnings Date End Date : Current Date + -2 Days
  3. Predicted Move (Next Day) Max : 7%
  4. Predicted Move (On 7th Day) Min : 7%

Strategy Guideline:

  1. Buy the stock if stock has reacted positively. Short the stock if stock has reacted negatively (see above).
  2. Close the position in 7-10 days, or possibly earlier based on price move.

Volatility Crush Strategy - Best for Options Traders

The Volatility Crush strategy is used with stocks that typically experience relatively low-to-moderate price moves (≤4%) following their Earnings Announcements (EA). The basic trade idea is to sell put or call options right before the EA, collecting a credit when options premium is very high due to elevated implied volatility (IV). You then close the position right after the EA by buying the option back much cheaper due to the significant drop in IV that occurs after the mystery of the EA disappears. In assessing this trade, you need to do your homework to ensure you collect sufficient premium to make the trade worthwhile.

This trade is practical due to the low-to-moderate price-move after the EA, which generally won’t significantly affect the options price, unlike an “action” stock, which experience great price moves post-EA. With these symbols, if you’re on the right side of the price move, that’s a great thing. But if you’re on the wrong side of the move, not so great. Consequently, by minimizing the effect of the post-EA price move, you have a much better chance to profit from the reduction in IV without it being ruined by a violent price move.

For this trade, open the position either (1) the night before the EA when the company announces earnings or (2) during the EA day when it announces post-market, generally capturing IV at or close to its peak.

For this trade, open the position either (1) the night before the EA when the company announces earnings or (2) during the EA day when it announces post-market, generally capturing IV at or close to its peak.

This popular stockearnings screen will give you a list of stocks which do not react more than 4% fpost-EA. It includes only those stocks whose earnings are releasing next day.

Screen criteria:

  1. Earnings Date Start Date : Current Date + 1
  2. Earnings Date End Date : Current Date + 1
  3. Predicted Move (Next Day) Max : 4%
  4. Options Type: Weekly

Strategy Guideline:

  1. Options Strategy: Sell Call and Put
  2. Options Strike Price: Current Stock Price – (% Predicated Move x 2)
  3. Expiration Date: It should generally be the closest expiry immediately after the EA.
  4. Buy Insurance: Buying back Call and Put at Strike price which 10% lower than Sell Strike Price is optional but recommended.

Watch Video for More Detail

Volatility Rush Strategy - Best for Options Traders

The Volatility Rush takes advantage of increasing options premiums into earnings announcements (EA) caused by an anticipated rise in Implied Volatility (IV). With this strategy, Buy a Call and Put at-the-money (a long straddle) 2-3 weeks before the EA when IV is lower. Sell the position either (1) the night before the EA when the company announces earnings pre-market, or (2) during the EA day when it announces post-market, generally capturing IV at or close to its peak.

This popular screen will give you a list of stocks whose Options premiums tend to rise into Earnings. It includes only those stocks whose Earnings are at least two weeks away from today.

Screen criteria:

  1. Earnings Date Start Date : Current Date + 15 Days
  2. Earnings Date End Date : Current Date + 30 Days
  3. Predicted Move (Next Day) Min : 5%
  4. Options Type: Weekly or Monthly if that lines up with the two to three-week lead-time for entering the trade

Strategy Guideline:

  1. Buy a Straddle at or close to the money two to three weeks pre-EA.
  2. Sell the position either the night before the EA when the company announces earnings pre-market, or during the EA day when it announces post-market.
  3. Expiration date should generally be the closest expiry immediately after the EA.
  4. Straddle price should not be more 60% of predicted move.

Predicted Move (Volatility)

Similar to Implied Volatility in Options. Expected volatility % based on our Proprietary Volatility Predication Model. We are expecting that stock price will likely to reach % in either direction by the end of next trading session after Earnings are released and not necessarily the closing volatility %.

Why is it important?

    This indicator helps

  1. Knowing expected volatility in stocks after Earnings helps to decide trading stocks before Earnings Announcement.
  2. Taking Advantage of volatility collapse following Earnings Results by using Advance Options strategies such as Spread and Straddles.

Since Last Earnings

Change in share price since last Earnings release.

Why is it Important?

When share has gained more than 10% since it's last Earning release, it tends to over react to minor bad news and give up some gains if not all. So, it contains more downside volatility than upside When share has dropped more than 10% since it's last Earning release, it tends to over react to minor good news and recover some drops if not all. So, it contains more upside volatility than downside.

EPS Surprise (%)

Occurs when a company's reported quarterly or annual profits are above or below analysts' expectations. Here is the formula to derive % EPS Surprice:

Actual EPS - Estimated EPS
------------------------------------- x 100
Estimated EPS

Why is it Important?

Earnings surprises can have a huge impact on a company's stock price. Several studies suggest that positive earnings surprises not only lead to an immediate hike in a stock's price, but also to a gradual increase over time. Hence, it's not surprising that some companies are known for routinely beating earning projections. A negative earnings surprise will usually result in a decline in share price.

Next Day Price Change (%)

Next Regular trading session Closing price following Earnings result.

For After Market Close Earnings, It is a next trading day closing price. For Before Market Open Earnings, It is the same trading day closing price.

Why is it Important?

Next Day price change is a reaction of Earnings result.

The SPY ETF Just Flashed a Warning Ahead of Costco’s (COST) Q2 Earnings

Posted on Mar 04, 2026 by Joshua Enomoto

The SPY ETF Just Flashed a Warning Ahead of Costco’s (COST) Q2 Earnings

I don’t want to sound too alarmist, but a massive warning sign just flashed for the SPDR S&P 500 ETF Trust (NYSEARCA: SPY) that may have serious implications for membership-only retailer Costco (NASDAQ: COST). One of the hallmarks of suburban economic power, Costco is about to release its second-quarter earnings report. But after a strong start to the new year, COST stock appears to be running on fumes.

At first glance, circumstances seem normal. For the upcoming disclosure, scheduled for release on Thursday after the closing bell, Wall Street analysts expect earnings per share of $4.54 on revenue of $69.26 billion. In the year-ago quarter, Costco posted EPS of $4.02 on revenue of $63.72 billion, a performance that missed slightly on the bottom line but exceeded on the top.

Generally, while Costco’s financial print can be hit-or-miss, market sentiment for COST stock tends to be positive. For example, over the past five years, the security has gained roughly 218%. Over the past year and a half, COST has carried an earnings multiple of over 50.

Basically, such a ratio translates to an earnings yield of around 2%, which some might argue is alarmingly low. After all, you could just put your money into risk-free Treasuries and get double the aforementioned yield.

As it turns out, some investors appear to be getting the message. In the past year, COST stock is down about 4%. With the U.S. and Israel launching a military strike against Iran, the disruption that this conflict poses for the global economy forces a rethink for previously high-powered names.

Volatility Skew Reveals a Cautious Outlook for COST Stock


As I’ve pointed out previously, volatility skew is one of the most important indicators to watch. Definitionally, the skew identifies implied volatility (IV) — or a stock’s potential range of motion — across the strike price spectrum of a given options chain. Essentially, it’s a screener that showcases the surface-area distortion of volatility space, allowing traders to identify how the smart money is positioning risk.

If we were to frame the skew as a security protocol, it would reveal the vulnerability points that are most at risk. Therefore, the entity seeking protection would beef up defenses to address said vulnerabilities. This beefing up leads to elevated put IV at the strike prices of concern.

What’s fascinating is that, for the April 17 expiration date, the skew shows put IV rising on both ends of the strike boundaries. With the rising skew toward the left-hand boundaries (toward lower strikes), this setup suggests that smart money traders are concerned about downside tail risk. Toward the right, the priority appears to be protecting actual long exposure to COST stock via synthetic shorts.

Notice what’s happening with call IV. Relative to puts, there’s little urgency to seek upside convexity. Again, the priority among sophisticated market participants appears to focus on not losing money rather than efforts toward extracting capital growth.

We see a similar skew for the March 6 weekly options chain, the expiration date closest to Costco’s Q2 disclosure. The bulk of curvature rise is concentrated on the far-left side of the spectrum. Again, the main motif here is that traders are focused on mitigating a sharp loss rather than betting on a rising share price.

The Warning Signal for Costco Stock and the Broader Index

According to the Black-Scholes-derived expected move calculator, Costco stock for the April 17 expiration date is expected to land between $933.68 and $1,081.34. However, this assumption is based on a static formula that does not account for prior market context. Essentially, it’s a reference marker — one that’s only valid if we assume a world that simply may not exist.

One of my biggest contentions about Black-Scholes is that the market generally operates under the Markov property; that is, forward probabilities depend on the context in which the calculations are being applied. For example, in a football game, the odds of winning the contest will change depending on whether you have a sizable lead or not.

My problem with relying exclusively on Black-Scholes to make forward estimations is that the formula is completely blind to context. So, whether COST stock has just completed a massive rally or recovered from a catastrophic fall, the same math is applied. Context is merely the starting point of a predefined analysis and offers no fundamental change to the estimated distribution.

Rather than this parametric (predefined) approach, Markov systems measure and account for the distributional changes that can occur due to different contexts. In the case of the broader equities market, the SPY ETF in the past 10 weeks printed seven up weeks. However, the overall slope of this 10-week trend has been negative.

COST - StockEarnings

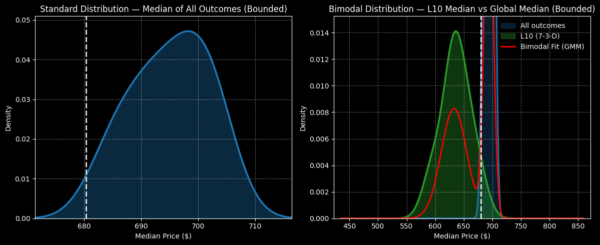
What’s so special about this 7-3-D sequence? It’s an extremely rare quantitative signal, for one. More critically, when this signal flashes, past analogs suggest that the future weeks could lead to sharply negative price action before an eventual slow recovery.

Now, it must be said that all future statements are inductive by nature; there’s nothing that logically compels the 7-3-D sequence to cause a downturn in the SPY ETF. However, my argument is that this unique harbinger is flashing at a particularly vulnerable time for the U.S.

Also, it’s worth keeping in mind that if the Iranians manage to drag the U.S. into a war of attrition, the geographic advantage (Iran being an extremely mountainous country) may lean to them. That’s another reason why I don’t view this signal as merely an inductive fantasy.

Where Does This Leave the Retailing Giant?

Turning our attention back to COST stock, the concern in the weeks ahead is that traders may be tempted to trim their exposure to the retailing giant. With a year-to-date performance of nearly 17% along with a hot earnings multiple, I’m not entirely sure if I trust the rally to continue.

COST - StockEarnings

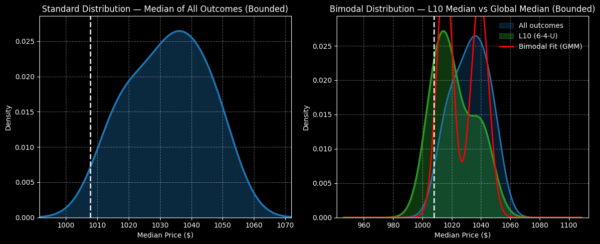
Further, COST’s quant signal — a 6-4-U sequence over the past 10 weeks — doesn’t lend itself to a particularly strong forward performance. Over the next 10 weeks, an inductive calculation predicts a range between $980 and $1,065. The problem, though, is that on an aggregate basis, the forward 10-week return would typically range between $990 and $1,070.

I’m not sure if I like the idea of paying a long premium for a quant signal with a lower-than-average probabilistic profile. For those who want to aggressively speculate, a near-term wager featuring the 985/980 bear put spread expiring March 6 could be enticing. Otherwise, COST stock might be a name to watch on the sidelines.

Joshua Enomoto is a seasoned financial writer with a strong track record of in-depth stock analysis, offering clear, insightful commentary for retail investors across all levels of expertise. Renowned for his ability to blend analytical rigor with engaging wit, Joshua's work has been featured on leading investment platforms, including TipRanks, InvestorPlace, Barchart, Benzinga, and Fintel. He was also handpicked to spearhead high-impact initiatives such as InvestorPlace's "Trade of the Day" and Benzinga’s ETF coverage. As a frequent guest expert for CGTN America, Joshua discusses a wide range of economic, societal, and consumer market trends. A graduate of U.C. San Diego, Joshua brings a thoughtful and fresh perspective to complex financial narratives, helping enterprise clients connect with their audiences. He also composes music in his spare time.

Join over 1.2M+ investors/traders who receive daily and weekly notable earnings alerts with predicted move