ajax loader

Loading...


Ride-the-Wave Strategy – Best for Stock Traders

Ride-the-Wave targets multi-day price momentum following a company’s earnings announcement (EA). With this strategy:

  1. Buy a stock one day post-EA if a stock reacts positively post-earnings:
    1. Near the close of trading the EA-day for a pre-market-EA
    2. Near the close of the following day for a post-market-EA
  2. Sell-to-close after 7-10 days, or possibly earlier if a desired price target is reached

Similarly,

  1. short a stock one day post-EA if a stock reacts negatively post-earnings:
    1. near the close of trading the EA-day for a premarket-EA
    2. near the close of the following day for a post-market-EA
  2. then buy-to-close after 7-10 days, or possibly earlier if a desired price target is reached

Important: Ride-the-Wave is predicated on significant price momentum triggered by an EA. The 7-10 day scenario is the maximum trade hold-time. If you see post EA-momentum is halted or reversed by a significant opposite move, re-evaluate your presence in the trade.

This popular StockEarnings screen below will give you a list of stocks that historically exhibit significant price momentum following an EA for the next seven days:

  1. Stocks exhibiting positive post-EA price moves are buy-candidates
  2. Stocks exhibiting negative post-EA price moves are sell/short-candidates

The screen includes those stocks whose Earnings just came out in last two days.

Screen criteria:

  1. Earnings Date Start Date : Current Date + -1 Day
  2. Earnings Date End Date : Current Date + -2 Days
  3. Predicted Move (Next Day) Max : 7%
  4. Predicted Move (On 7th Day) Min : 7%

Strategy Guideline:

  1. Buy the stock if stock has reacted positively. Short the stock if stock has reacted negatively (see above).
  2. Close the position in 7-10 days, or possibly earlier based on price move.

Volatility Crush Strategy - Best for Options Traders

The Volatility Crush strategy is used with stocks that typically experience relatively low-to-moderate price moves (≤4%) following their Earnings Announcements (EA). The basic trade idea is to sell put or call options right before the EA, collecting a credit when options premium is very high due to elevated implied volatility (IV). You then close the position right after the EA by buying the option back much cheaper due to the significant drop in IV that occurs after the mystery of the EA disappears. In assessing this trade, you need to do your homework to ensure you collect sufficient premium to make the trade worthwhile.

This trade is practical due to the low-to-moderate price-move after the EA, which generally won’t significantly affect the options price, unlike an “action” stock, which experience great price moves post-EA. With these symbols, if you’re on the right side of the price move, that’s a great thing. But if you’re on the wrong side of the move, not so great. Consequently, by minimizing the effect of the post-EA price move, you have a much better chance to profit from the reduction in IV without it being ruined by a violent price move.

For this trade, open the position either (1) the night before the EA when the company announces earnings or (2) during the EA day when it announces post-market, generally capturing IV at or close to its peak.

For this trade, open the position either (1) the night before the EA when the company announces earnings or (2) during the EA day when it announces post-market, generally capturing IV at or close to its peak.

This popular stockearnings screen will give you a list of stocks which do not react more than 4% fpost-EA. It includes only those stocks whose earnings are releasing next day.

Screen criteria:

  1. Earnings Date Start Date : Current Date + 1
  2. Earnings Date End Date : Current Date + 1
  3. Predicted Move (Next Day) Max : 4%
  4. Options Type: Weekly

Strategy Guideline:

  1. Options Strategy: Sell Call and Put
  2. Options Strike Price: Current Stock Price – (% Predicated Move x 2)
  3. Expiration Date: It should generally be the closest expiry immediately after the EA.
  4. Buy Insurance: Buying back Call and Put at Strike price which 10% lower than Sell Strike Price is optional but recommended.

Watch Video for More Detail

Volatility Rush Strategy - Best for Options Traders

The Volatility Rush takes advantage of increasing options premiums into earnings announcements (EA) caused by an anticipated rise in Implied Volatility (IV). With this strategy, Buy a Call and Put at-the-money (a long straddle) 2-3 weeks before the EA when IV is lower. Sell the position either (1) the night before the EA when the company announces earnings pre-market, or (2) during the EA day when it announces post-market, generally capturing IV at or close to its peak.

This popular screen will give you a list of stocks whose Options premiums tend to rise into Earnings. It includes only those stocks whose Earnings are at least two weeks away from today.

Screen criteria:

  1. Earnings Date Start Date : Current Date + 15 Days
  2. Earnings Date End Date : Current Date + 30 Days
  3. Predicted Move (Next Day) Min : 5%
  4. Options Type: Weekly or Monthly if that lines up with the two to three-week lead-time for entering the trade

Strategy Guideline:

  1. Buy a Straddle at or close to the money two to three weeks pre-EA.
  2. Sell the position either the night before the EA when the company announces earnings pre-market, or during the EA day when it announces post-market.
  3. Expiration date should generally be the closest expiry immediately after the EA.
  4. Straddle price should not be more 60% of predicted move.

Predicted Move (Volatility)

Similar to Implied Volatility in Options. Expected volatility % based on our Proprietary Volatility Predication Model. We are expecting that stock price will likely to reach % in either direction by the end of next trading session after Earnings are released and not necessarily the closing volatility %.

Why is it important?

    This indicator helps

  1. Knowing expected volatility in stocks after Earnings helps to decide trading stocks before Earnings Announcement.
  2. Taking Advantage of volatility collapse following Earnings Results by using Advance Options strategies such as Spread and Straddles.

Since Last Earnings

Change in share price since last Earnings release.

Why is it Important?

When share has gained more than 10% since it's last Earning release, it tends to over react to minor bad news and give up some gains if not all. So, it contains more downside volatility than upside When share has dropped more than 10% since it's last Earning release, it tends to over react to minor good news and recover some drops if not all. So, it contains more upside volatility than downside.

EPS Surprise (%)

Occurs when a company's reported quarterly or annual profits are above or below analysts' expectations. Here is the formula to derive % EPS Surprice:

Actual EPS - Estimated EPS
------------------------------------- x 100
Estimated EPS

Why is it Important?

Earnings surprises can have a huge impact on a company's stock price. Several studies suggest that positive earnings surprises not only lead to an immediate hike in a stock's price, but also to a gradual increase over time. Hence, it's not surprising that some companies are known for routinely beating earning projections. A negative earnings surprise will usually result in a decline in share price.

Next Day Price Change (%)

Next Regular trading session Closing price following Earnings result.

For After Market Close Earnings, It is a next trading day closing price. For Before Market Open Earnings, It is the same trading day closing price.

Why is it Important?

Next Day price change is a reaction of Earnings result.

NVIDIA Crushed Q2 Earnings and Still Buried the Lead

Posted on Aug 27, 2026 by Chris Markoch

NVIDIA Crushed Q2 Earnings and Still Buried the Lead

NVIDIA (NASDAQ: NVDA) delivered another quarter that should have ended the “AI bubble” debate for good, yet the biggest number in the entire report barely made the headlines. The company posted $96.2 billion in Q2 fiscal 2027 revenue, up 106% year over year, alongside GAAP earnings of $2.46 per share, up 128%. Data center revenue hit $89 billion, up 117%. Gross margin expanded to 75.0% on both a GAAP and non-GAAP basis. Every one of those numbers beat Wall Street’s consensus estimates, and every one of those numbers is, in isolation, a good story.

But the real story came later on the call, almost as an aside. CFO Colette Kress told analysts that NVIDIA expects fiscal 2028 revenue to grow approximately 70%. Analysts had been modeling something closer to 44%. That’s not a modest beat-and-raise. That’s a company telling Wall Street its models are broken, and doing it in a monotone during the Q&A portion of an earnings call, as if it were a footnote.

This is the perception-versus-fundamentals gap in its purest form. The perception, reinforced by a stock that’s essentially flat this year and a chorus of bubble-callers, is that the company’s growth has to slow from here. The fundamentals, delivered by the person who actually sees the order book, say growth is about to accelerate.

What 70% Revenue Growth Could Mean for NVIDIA’s Free Cash Flow


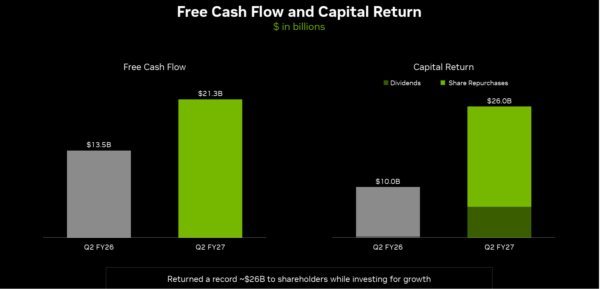
Start with what NVIDIA just did, then extrapolate. Free cash flow came in at $21.3 billion for the quarter, up from $13.5 billion a year ago, even as the company poured capital into supply and capacity. Capital returns hit a record $26 billion in dividends and buybacks. That’s a business generating enormous cash while still in expansion mode.
nvidia-StockEarnings

Now apply Kress’s 70% growth framework to fiscal 2028. If revenue scales anywhere near that pace off a base that just topped $96 billion in a single quarter, the free cash flow implications are staggering, even accounting for the memory-cost pressures and capacity constraints management flagged.

A discounted cash flow model built on 44% growth and one built on 70% growth produce very different valuations. Every dollar of near-term cash flow compounds forward under a higher terminal growth assumption, and the gap between those two DCF outputs is exactly the gap the market has yet to close. Kress herself said customer forecasts point to growth “doubling” next year, with the 70% figure reflecting supply constraints rather than a demand ceiling. That’s a company saying it could grow faster if it could build more.

NVIDIA’s Growth Outlook Could Force Analysts to Raise Price Targets

Wall Street was already leaning bullish heading into this print. Citi held a buy rating and a $300 target ahead of earnings while nudging fiscal 2027, 2028, and 2029 EPS estimates higher. Morgan Stanley carried an Overweight rating and a $288 target. The broader analyst community had clustered price targets between roughly $275 and $325, with an average north of $300, even before hearing the FY2028 number.

That was all built on a 44% growth assumption for next year. With Kress now guiding to 70%, and with backlog reportedly exceeding $2 trillion, expect a fresh wave of price target increases in the days ahead. Analysts will need to run new models, but the direction is not in question. When a company beats the current quarter by $2-4 billion in revenue and simultaneously moves the entire following year’s growth rate up by roughly 26 percentage points, price targets don’t hold still. Investors should expect a string of upgrades, not a single round.

NVDA Technical Analysis: 200-Day SMA Remains Key Support

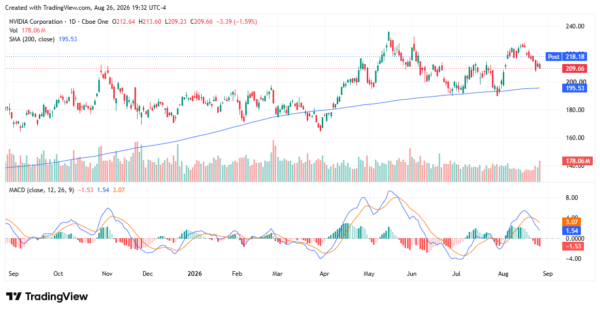
Heading into the print, NVDA shares closed at $209.66, down 1.59% on the day, still comfortably above their rising 200-day simple moving average near $195.53. That average has acted as reliable support since the stock’s spring pullback, when NVIDIA dropped from an all-time high near $240 to the $180s before rebuilding.

The MACD had been flashing a bit of near-term hesitation, with momentum cooling after a summer rally that carried the stock from roughly $195 back above $215. That’s a normal pause within an intact uptrend, not a breakdown.
nvidia - StockEarnings

NVDA Stock Could Retest Its All-Time High

Shares moved higher in after-hours trading following the report, a signal that the market is beginning to price in the guidance shock rather than just the quarterly beat. A push back toward the $230-$240 range would put NVIDIA within striking distance of retesting its prior highs, and a clean break above that zone, backed by the fiscal 2028 growth story, would be a technical confirmation of what the fundamentals are already saying.

NVIDIA’s Earnings Report Challenges the AI Bubble Narrative

NVIDIA didn’t just beat earnings. It told Wall Street to rebuild its models for next year, and it did so quietly, in the middle of a call, almost as if daring analysts to catch up. The comps only get tougher from here, and NVIDIA just guided to accelerating growth anyway. That’s not the profile of a company riding a bubble toward a pop. It’s the profile of a company still being underestimated, even after a decade of proving that instinct wrong. The lead got buried. It won’t stay that way once the price targets start rolling in.


A former marketing copywriter turned freelance financial writer and market analyst. I have a passion for delivering insights to investors. I write regularly about stocks for StockEarnings and MarketBeat. Posts are not advice.

Join over 1.2M+ investors/traders who receive daily and weekly notable earnings alerts with predicted move