ajax loader

Loading...


Ride-the-Wave Strategy – Best for Stock Traders

Ride-the-Wave targets multi-day price momentum following a company’s earnings announcement (EA). With this strategy:

  1. Buy a stock one day post-EA if a stock reacts positively post-earnings:
    1. Near the close of trading the EA-day for a pre-market-EA
    2. Near the close of the following day for a post-market-EA
  2. Sell-to-close after 7-10 days, or possibly earlier if a desired price target is reached

Similarly,

  1. short a stock one day post-EA if a stock reacts negatively post-earnings:
    1. near the close of trading the EA-day for a premarket-EA
    2. near the close of the following day for a post-market-EA
  2. then buy-to-close after 7-10 days, or possibly earlier if a desired price target is reached

Important: Ride-the-Wave is predicated on significant price momentum triggered by an EA. The 7-10 day scenario is the maximum trade hold-time. If you see post EA-momentum is halted or reversed by a significant opposite move, re-evaluate your presence in the trade.

This popular StockEarnings screen below will give you a list of stocks that historically exhibit significant price momentum following an EA for the next seven days:

  1. Stocks exhibiting positive post-EA price moves are buy-candidates
  2. Stocks exhibiting negative post-EA price moves are sell/short-candidates

The screen includes those stocks whose Earnings just came out in last two days.

Screen criteria:

  1. Earnings Date Start Date : Current Date + -1 Day
  2. Earnings Date End Date : Current Date + -2 Days
  3. Predicted Move (Next Day) Max : 7%
  4. Predicted Move (On 7th Day) Min : 7%

Strategy Guideline:

  1. Buy the stock if stock has reacted positively. Short the stock if stock has reacted negatively (see above).
  2. Close the position in 7-10 days, or possibly earlier based on price move.

Volatility Crush Strategy - Best for Options Traders

The Volatility Crush strategy is used with stocks that typically experience relatively low-to-moderate price moves (≤4%) following their Earnings Announcements (EA). The basic trade idea is to sell put or call options right before the EA, collecting a credit when options premium is very high due to elevated implied volatility (IV). You then close the position right after the EA by buying the option back much cheaper due to the significant drop in IV that occurs after the mystery of the EA disappears. In assessing this trade, you need to do your homework to ensure you collect sufficient premium to make the trade worthwhile.

This trade is practical due to the low-to-moderate price-move after the EA, which generally won’t significantly affect the options price, unlike an “action” stock, which experience great price moves post-EA. With these symbols, if you’re on the right side of the price move, that’s a great thing. But if you’re on the wrong side of the move, not so great. Consequently, by minimizing the effect of the post-EA price move, you have a much better chance to profit from the reduction in IV without it being ruined by a violent price move.

For this trade, open the position either (1) the night before the EA when the company announces earnings or (2) during the EA day when it announces post-market, generally capturing IV at or close to its peak.

For this trade, open the position either (1) the night before the EA when the company announces earnings or (2) during the EA day when it announces post-market, generally capturing IV at or close to its peak.

This popular stockearnings screen will give you a list of stocks which do not react more than 4% fpost-EA. It includes only those stocks whose earnings are releasing next day.

Screen criteria:

  1. Earnings Date Start Date : Current Date + 1
  2. Earnings Date End Date : Current Date + 1
  3. Predicted Move (Next Day) Max : 4%
  4. Options Type: Weekly

Strategy Guideline:

  1. Options Strategy: Sell Call and Put
  2. Options Strike Price: Current Stock Price – (% Predicated Move x 2)
  3. Expiration Date: It should generally be the closest expiry immediately after the EA.
  4. Buy Insurance: Buying back Call and Put at Strike price which 10% lower than Sell Strike Price is optional but recommended.

Watch Video for More Detail

Volatility Rush Strategy - Best for Options Traders

The Volatility Rush takes advantage of increasing options premiums into earnings announcements (EA) caused by an anticipated rise in Implied Volatility (IV). With this strategy, Buy a Call and Put at-the-money (a long straddle) 2-3 weeks before the EA when IV is lower. Sell the position either (1) the night before the EA when the company announces earnings pre-market, or (2) during the EA day when it announces post-market, generally capturing IV at or close to its peak.

This popular screen will give you a list of stocks whose Options premiums tend to rise into Earnings. It includes only those stocks whose Earnings are at least two weeks away from today.

Screen criteria:

  1. Earnings Date Start Date : Current Date + 15 Days
  2. Earnings Date End Date : Current Date + 30 Days
  3. Predicted Move (Next Day) Min : 5%
  4. Options Type: Weekly or Monthly if that lines up with the two to three-week lead-time for entering the trade

Strategy Guideline:

  1. Buy a Straddle at or close to the money two to three weeks pre-EA.
  2. Sell the position either the night before the EA when the company announces earnings pre-market, or during the EA day when it announces post-market.
  3. Expiration date should generally be the closest expiry immediately after the EA.
  4. Straddle price should not be more 60% of predicted move.

Predicted Move (Volatility)

Similar to Implied Volatility in Options. Expected volatility % based on our Proprietary Volatility Predication Model. We are expecting that stock price will likely to reach % in either direction by the end of next trading session after Earnings are released and not necessarily the closing volatility %.

Why is it important?

    This indicator helps

  1. Knowing expected volatility in stocks after Earnings helps to decide trading stocks before Earnings Announcement.
  2. Taking Advantage of volatility collapse following Earnings Results by using Advance Options strategies such as Spread and Straddles.

Since Last Earnings

Change in share price since last Earnings release.

Why is it Important?

When share has gained more than 10% since it's last Earning release, it tends to over react to minor bad news and give up some gains if not all. So, it contains more downside volatility than upside When share has dropped more than 10% since it's last Earning release, it tends to over react to minor good news and recover some drops if not all. So, it contains more upside volatility than downside.

EPS Surprise (%)

Occurs when a company's reported quarterly or annual profits are above or below analysts' expectations. Here is the formula to derive % EPS Surprice:

Actual EPS - Estimated EPS
------------------------------------- x 100
Estimated EPS

Why is it Important?

Earnings surprises can have a huge impact on a company's stock price. Several studies suggest that positive earnings surprises not only lead to an immediate hike in a stock's price, but also to a gradual increase over time. Hence, it's not surprising that some companies are known for routinely beating earning projections. A negative earnings surprise will usually result in a decline in share price.

Next Day Price Change (%)

Next Regular trading session Closing price following Earnings result.

For After Market Close Earnings, It is a next trading day closing price. For Before Market Open Earnings, It is the same trading day closing price.

Why is it Important?

Next Day price change is a reaction of Earnings result.

Costco: A Warehouse Store Trading at a Tech Multiple

Posted on Aug 27, 2026 by Grayson Cavern

Costco: A Warehouse Store Trading at a Tech Multiple

At roughly 48 times trailing earnings, Costco Wholesale Corp (NASDAQ: COST) is asking investors to pay a price normally associated with companies growing far faster than a warehouse retailer. That alone should make anyone hovering over the buy button stop for a second.

Because Costco is a fantastic business, sure. But fantastic businesses can still be terrible stocks when the price gets ahead of what the business can realistically deliver.

Costco’s valuation is therefore where this article starts. The stock trades around 42 times forward earnings, which means investors are already handing over a hefty price for every dollar the company is expected to make next year.

And that got me thinking. What is it the market is actually paying for?

Because investors clearly are not looking at Costco the way they look at an ordinary retailer. A normal warehouse store does not command this kind of multiple. Something else is happening underneath the pallets, the bulk groceries, and the $1.50 hot dogs. So I went through the latest numbers, again, looking for the answer.

Costco Is Selling Something More Valuable Than Groceries


Costco’s quarter 3 earnings quickly explains why the market keeps treating this company differently from other retailers like Walmart Inc. (NYSE: WMT), BJ’s Wholesale Club Holdings Inc. (NYSE: BJ), Target Corporation (NYSE: TGT). Net sales rose 11.6% to $69.15 billion, while comparable sales increased 9.8%, or 6.6% after adjusting for gasoline prices and foreign exchange. Digitally enabled comparable sales climbed 21.5%.

Those numbers are strong, but the membership machine is where things start getting serious. Quarterly membership fees reached $1.373 billion, up 10.7% year over year, while paid memberships climbed to 82.9 million.

Then Costco renewed 92.2% of its U.S. and Canadian memberships and 89.7% worldwide, meaning roughly nine out of every 10 members continued paying for access to the warehouse. Executive memberships reached 41.2 million, and these members typically spend more than standard members. Add to that Costco’s millions of customers voluntarily paying for the right to keep shopping there, then renewing at rates most businesses would kill for. The membership fees also come with an attractive margin structure because Costco deliberately keeps merchandise margins thin to maintain its pricing advantage.

The cash coming through the business backs up the story. Operating cash flow reached $11.133 billion over the first 36 weeks of fiscal 2026, up from $9.468 billion during the same period last year. So, fine. I get it now. Costco is trading like a premium company because investors see a recurring membership engine sitting on top of a giant retail operation that keeps producing more cash.

But understanding the premium and agreeing to pay any price for it are two different things.

The Burden Of A 48x Earnings

Buying Costco at roughly 48 times trailing earnings means your investment needs several things to keep going right. Membership growth cannot suddenly stall, renewal rates need to stay high, customer spending has to remain healthy, and the company has to keep turning all of that activity into growing profits and cash.

Costco does not need to report bad earnings for the stock to disappoint from here. Imagine the company continues growing, but revenue growth cools and comparable sales move from strong to merely okay. Investors could still decide they are no longer comfortable paying 48 times earnings. The business would still be healthy and your investment could still get hit. That is the risk embedded in owning a stock at this valuation. A drop from 48x to 35x earnings would be painful even if Costco continued increasing profits.

And I think that gets lost whenever people dismiss valuation concerns by saying, “It’s Costco.” Yeah, it is Costco. But the price you pay today determines how much of Costco’s future growth actually belongs to you as a new investor.

At this level, I am assuming that the membership engine keeps compounding, the company keeps opening productive warehouses, comparable sales remain healthy, digital continues gaining traction, and the cash flow keeps climbing. That is a lot already sitting inside the stock.

The Chart Shows Buyers Are Still Thinking About It

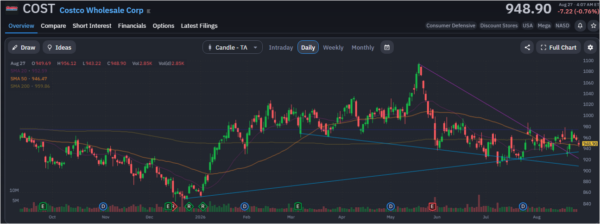
Costco’s chart suggests the market has not reached a final answer on that valuation either. Shares ran to roughly $1,096 in May, sold off sharply, and then spent the following months moving sideways instead of charging straight back toward the highs.

That matters because the company’s latest business results have remained strong.

With COST trading around $949, the stock is hovering around its major moving averages on the chart, including the 20-day, 50-day, and 200-day averages, while buyers and sellers continue fighting for control after the May peak.

A decisive move through the $980 to $1,000 area would put the old high back into focus and show that buyers are again willing to pay up. A loss of the $920 to $930 zone would point the other way. This isn’t a broken chart, however, the company’s strong fundamentals have not automatically been enough to send the stock back to its old highs.
costco-StockEarnings

I Need More Room

I understand the bull case much better after digging into the numbers again, but 48 times trailing earnings is where my excitement starts competing with my entry price. Costco may keep delivering and still struggle to reward investors who buy too high. The company has earned its premium. Whether the stock has earned another dollar of that premium is a different bet. Ideally, I’d want more room between the price I pay and the number of things that must keep going right.


Join over 1.2M+ investors/traders who receive daily and weekly notable earnings alerts with predicted move