ajax loader

Loading...


Ride-the-Wave Strategy – Best for Stock Traders

Ride-the-Wave targets multi-day price momentum following a company’s earnings announcement (EA). With this strategy:

  1. Buy a stock one day post-EA if a stock reacts positively post-earnings:
    1. Near the close of trading the EA-day for a pre-market-EA
    2. Near the close of the following day for a post-market-EA
  2. Sell-to-close after 7-10 days, or possibly earlier if a desired price target is reached

Similarly,

  1. short a stock one day post-EA if a stock reacts negatively post-earnings:
    1. near the close of trading the EA-day for a premarket-EA
    2. near the close of the following day for a post-market-EA
  2. then buy-to-close after 7-10 days, or possibly earlier if a desired price target is reached

Important: Ride-the-Wave is predicated on significant price momentum triggered by an EA. The 7-10 day scenario is the maximum trade hold-time. If you see post EA-momentum is halted or reversed by a significant opposite move, re-evaluate your presence in the trade.

This popular StockEarnings screen below will give you a list of stocks that historically exhibit significant price momentum following an EA for the next seven days:

  1. Stocks exhibiting positive post-EA price moves are buy-candidates
  2. Stocks exhibiting negative post-EA price moves are sell/short-candidates

The screen includes those stocks whose Earnings just came out in last two days.

Screen criteria:

  1. Earnings Date Start Date : Current Date + -1 Day
  2. Earnings Date End Date : Current Date + -2 Days
  3. Predicted Move (Next Day) Max : 7%
  4. Predicted Move (On 7th Day) Min : 7%

Strategy Guideline:

  1. Buy the stock if stock has reacted positively. Short the stock if stock has reacted negatively (see above).
  2. Close the position in 7-10 days, or possibly earlier based on price move.

Volatility Crush Strategy - Best for Options Traders

The Volatility Crush strategy is used with stocks that typically experience relatively low-to-moderate price moves (≤4%) following their Earnings Announcements (EA). The basic trade idea is to sell put or call options right before the EA, collecting a credit when options premium is very high due to elevated implied volatility (IV). You then close the position right after the EA by buying the option back much cheaper due to the significant drop in IV that occurs after the mystery of the EA disappears. In assessing this trade, you need to do your homework to ensure you collect sufficient premium to make the trade worthwhile.

This trade is practical due to the low-to-moderate price-move after the EA, which generally won’t significantly affect the options price, unlike an “action” stock, which experience great price moves post-EA. With these symbols, if you’re on the right side of the price move, that’s a great thing. But if you’re on the wrong side of the move, not so great. Consequently, by minimizing the effect of the post-EA price move, you have a much better chance to profit from the reduction in IV without it being ruined by a violent price move.

For this trade, open the position either (1) the night before the EA when the company announces earnings or (2) during the EA day when it announces post-market, generally capturing IV at or close to its peak.

For this trade, open the position either (1) the night before the EA when the company announces earnings or (2) during the EA day when it announces post-market, generally capturing IV at or close to its peak.

This popular stockearnings screen will give you a list of stocks which do not react more than 4% fpost-EA. It includes only those stocks whose earnings are releasing next day.

Screen criteria:

  1. Earnings Date Start Date : Current Date + 1
  2. Earnings Date End Date : Current Date + 1
  3. Predicted Move (Next Day) Max : 4%
  4. Options Type: Weekly

Strategy Guideline:

  1. Options Strategy: Sell Call and Put
  2. Options Strike Price: Current Stock Price – (% Predicated Move x 2)
  3. Expiration Date: It should generally be the closest expiry immediately after the EA.
  4. Buy Insurance: Buying back Call and Put at Strike price which 10% lower than Sell Strike Price is optional but recommended.

Watch Video for More Detail

Volatility Rush Strategy - Best for Options Traders

The Volatility Rush takes advantage of increasing options premiums into earnings announcements (EA) caused by an anticipated rise in Implied Volatility (IV). With this strategy, Buy a Call and Put at-the-money (a long straddle) 2-3 weeks before the EA when IV is lower. Sell the position either (1) the night before the EA when the company announces earnings pre-market, or (2) during the EA day when it announces post-market, generally capturing IV at or close to its peak.

This popular screen will give you a list of stocks whose Options premiums tend to rise into Earnings. It includes only those stocks whose Earnings are at least two weeks away from today.

Screen criteria:

  1. Earnings Date Start Date : Current Date + 15 Days
  2. Earnings Date End Date : Current Date + 30 Days
  3. Predicted Move (Next Day) Min : 5%
  4. Options Type: Weekly or Monthly if that lines up with the two to three-week lead-time for entering the trade

Strategy Guideline:

  1. Buy a Straddle at or close to the money two to three weeks pre-EA.
  2. Sell the position either the night before the EA when the company announces earnings pre-market, or during the EA day when it announces post-market.
  3. Expiration date should generally be the closest expiry immediately after the EA.
  4. Straddle price should not be more 60% of predicted move.

Predicted Move (Volatility)

Similar to Implied Volatility in Options. Expected volatility % based on our Proprietary Volatility Predication Model. We are expecting that stock price will likely to reach % in either direction by the end of next trading session after Earnings are released and not necessarily the closing volatility %.

Why is it important?

    This indicator helps

  1. Knowing expected volatility in stocks after Earnings helps to decide trading stocks before Earnings Announcement.
  2. Taking Advantage of volatility collapse following Earnings Results by using Advance Options strategies such as Spread and Straddles.

Since Last Earnings

Change in share price since last Earnings release.

Why is it Important?

When share has gained more than 10% since it's last Earning release, it tends to over react to minor bad news and give up some gains if not all. So, it contains more downside volatility than upside When share has dropped more than 10% since it's last Earning release, it tends to over react to minor good news and recover some drops if not all. So, it contains more upside volatility than downside.

EPS Surprise (%)

Occurs when a company's reported quarterly or annual profits are above or below analysts' expectations. Here is the formula to derive % EPS Surprice:

Actual EPS - Estimated EPS
------------------------------------- x 100
Estimated EPS

Why is it Important?

Earnings surprises can have a huge impact on a company's stock price. Several studies suggest that positive earnings surprises not only lead to an immediate hike in a stock's price, but also to a gradual increase over time. Hence, it's not surprising that some companies are known for routinely beating earning projections. A negative earnings surprise will usually result in a decline in share price.

Next Day Price Change (%)

Next Regular trading session Closing price following Earnings result.

For After Market Close Earnings, It is a next trading day closing price. For Before Market Open Earnings, It is the same trading day closing price.

Why is it Important?

Next Day price change is a reaction of Earnings result.

Medtronic Earnings: Fundamentals Finally Match Perception

Posted on Sep 02, 2026 by Chris Markoch

Medtronic Earnings: Fundamentals Finally Match Perception

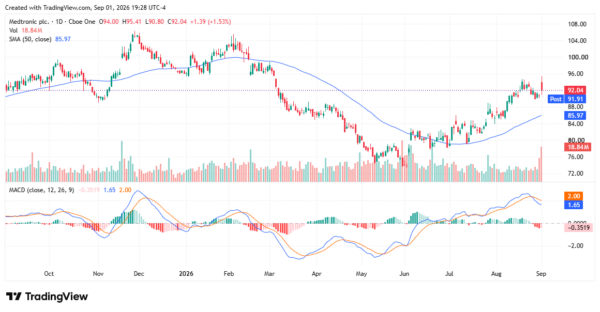
Medtronic (NYSE: MDT) delivered its strongest quarterly organic growth in nearly eight years, excluding COVID, and the market noticed. Shares jumped over 1.5% on the report, closing near $92 after touching a 52-week high above $95 intraday. For a stock that has spent much of the last year trading on tariff worries and separation timelines rather than fundamentals, this was the kind of print that could shift the narrative.

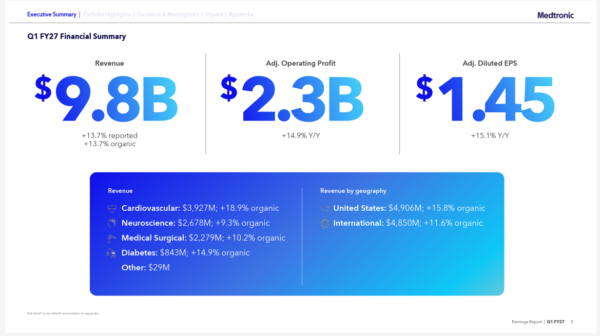
Revenue hit $9.8 billion, up 13.7% organically, while adjusted EPS of $1.45 beat guidance by six cents. Every major segment grew, and management didn’t just meet expectations—it raised them for the rest of fiscal 2027.
medtronic - StockEarnings

That may change the story coming out of earnings. Medtronic has long been treated as a slow-growth medtech name, a dividend payer rather than a growth stock. This earnings report argues otherwise, at least for now.

Medtronic Earnings Beat: Is MDT Stock Ready to Break Out?


Cardiovascular revenue grew 19% year-over-year, led by Cardiac Ablation Solutions, which surged 88% globally and 139% in the U.S. That business surpassed $2 billion in trailing twelve-month revenue and gained nine points of U.S. market share. The Affera Sphere-9 catheter drove much of that momentum, with the U.S. installed base up more than 35% sequentially.

Neuroscience and Medical Surgical also contributed. Cardiac Rhythm Management grew 15% globally. Cranial & Spinal Technologies grew 13%, helped by the newly launched Stealth AXiS platform. Medical Surgical grew 10%, with Acute Care & Monitoring up 14% on video laryngoscope strength.

Hugo, Medtronic’s robotic-assisted surgery system, is on track to surpass 50,000 completed global procedures by fiscal year-end. Procedure growth is running at more than twice the market rate. Altaviva, the company’s tibial neuromodulation implant, saw active implanters more than double sequentially. These are the newer platforms management has been asking investors to be patient with. This quarter, patience started paying off.

Medtronic Stock: Strong Earnings Put Growth Back in Focus

Medtronic raised full-year organic revenue growth guidance by 50 basis points, to a range of 7.25% to 7.75%. Adjusted EPS guidance moved up to $5.94–$6.00, implying 7.4% to 8.5% growth for the year. Management still expects operating profit growth of roughly 10%, with operating margin expanding about 50 basis points.

That guidance bump matters more than the headline beat. Companies routinely beat a single quarter’s numbers without changing the full-year picture. Medtronic did both, and it did so while absorbing tariffs, increased M&A activity, and the pending consolidation of its Diabetes business.

MDT Stock Surges as Medtronic Earnings Change the Narrative

Not everything in this report is pure tailwind. An extra selling week contributed approximately $570 million, or 670 basis points, to organic revenue growth this quarter. That’s a one-time boost. Management expects second-quarter organic growth to normalize to roughly 6%, and it flagged that Acute Care & Monitoring’s mid-teens growth rate should cool as the year progresses.

The company is also spending. A $700 million strategic investment in Cornerstone Robotics expands Medtronic’s global surgical robotics footprint, but it comes with foregone interest expense that will weigh on near-term margins. That’s the trade-off of reinvesting in growth platforms while markets reward immediate profitability.

The planned separation of the Diabetes business, expected via a split-off, remains on track for before the fiscal year-end. But management was careful to note that the timing still depends on achieving optimal economics for shareholders. Guidance currently includes Diabetes for the full year; if the separation closes earlier, expect another revision to guidance.

Medtronic Earnings: Strong Growth Could Finally Lift MDT Stock

When I last covered Medtronic in February, the stock had just posted a strong quarter but only reiterated prior guidance. MDT was sitting at its 150-day moving average, with a possible double-top forming near $95–$100. That support didn’t hold. Shares fell sharply through the spring, bottoming near $76 in early May before beginning a slow climb back.

The chart today looks meaningfully different. MDT closed near $92, comfortably above its 50-day simple moving average of roughly $86. That moving average has been sloping upward since June, a sign the recovery trend has staying power rather than representing a short-lived bounce.

The MACD (12, 26, 9) is also constructive. The MACD line sits above its signal line, with both in positive territory, and the histogram has been green for weeks. That’s a healthier setup than the weakening momentum flagged in the February piece. Volume on the earnings gap was elevated, consistent with genuine buying interest rather than a low-conviction pop.

The stock still needs to clear resistance in the $95–$100 zone, the same range where it topped out last time. A close above $100 would put the December 2025 high near $106 back in play. Until then, treat that zone as the level to watch. A rejection there would echo the pattern from earlier this year.
medtronic - StockEarnings

MDT Stock Has Momentum After Medtronic’s Strong Earnings Beat

Medtronic’s fiscal Q1 report was strong by nearly every measure: revenue, margins, EPS, and forward guidance all moved in the right direction. The perception of Medtronic as a low-growth, tariff-burdened medtech name is increasingly at odds with a company posting double-digit organic growth across every segment. The chart has also repaired itself, trading above a rising 50-day moving average with improving momentum, a contrast to the failed support test that defined the February setup.

That doesn’t mean the stock is a straight line higher from here. The extra selling week flatters this quarter’s growth rate. Acute Care & Monitoring growth should decelerate, and the Cornerstone Robotics investment will pressure near-term margins. The Diabetes separation also remains a moving target. But for investors who track the gap between narrative and numbers, this quarter narrowed it considerably. Medtronic still needs to clear that $95–$100 resistance zone to prove the fundamentals story has staying power. Until it does, the setup is improved, but not yet resolved.


A former marketing copywriter turned freelance financial writer and market analyst. I have a passion for delivering insights to investors. I write regularly about stocks for StockEarnings and MarketBeat. Posts are not advice.

Join over 1.2M+ investors/traders who receive daily and weekly notable earnings alerts with predicted move