ajax loader

Loading...


Ride-the-Wave Strategy – Best for Stock Traders

Ride-the-Wave targets multi-day price momentum following a company’s earnings announcement (EA). With this strategy:

  1. Buy a stock one day post-EA if a stock reacts positively post-earnings:
    1. Near the close of trading the EA-day for a pre-market-EA
    2. Near the close of the following day for a post-market-EA
  2. Sell-to-close after 7-10 days, or possibly earlier if a desired price target is reached

Similarly,

  1. short a stock one day post-EA if a stock reacts negatively post-earnings:
    1. near the close of trading the EA-day for a premarket-EA
    2. near the close of the following day for a post-market-EA
  2. then buy-to-close after 7-10 days, or possibly earlier if a desired price target is reached

Important: Ride-the-Wave is predicated on significant price momentum triggered by an EA. The 7-10 day scenario is the maximum trade hold-time. If you see post EA-momentum is halted or reversed by a significant opposite move, re-evaluate your presence in the trade.

This popular StockEarnings screen below will give you a list of stocks that historically exhibit significant price momentum following an EA for the next seven days:

  1. Stocks exhibiting positive post-EA price moves are buy-candidates
  2. Stocks exhibiting negative post-EA price moves are sell/short-candidates

The screen includes those stocks whose Earnings just came out in last two days.

Screen criteria:

  1. Earnings Date Start Date : Current Date + -1 Day
  2. Earnings Date End Date : Current Date + -2 Days
  3. Predicted Move (Next Day) Max : 7%
  4. Predicted Move (On 7th Day) Min : 7%

Strategy Guideline:

  1. Buy the stock if stock has reacted positively. Short the stock if stock has reacted negatively (see above).
  2. Close the position in 7-10 days, or possibly earlier based on price move.

Volatility Crush Strategy - Best for Options Traders

The Volatility Crush strategy is used with stocks that typically experience relatively low-to-moderate price moves (≤4%) following their Earnings Announcements (EA). The basic trade idea is to sell put or call options right before the EA, collecting a credit when options premium is very high due to elevated implied volatility (IV). You then close the position right after the EA by buying the option back much cheaper due to the significant drop in IV that occurs after the mystery of the EA disappears. In assessing this trade, you need to do your homework to ensure you collect sufficient premium to make the trade worthwhile.

This trade is practical due to the low-to-moderate price-move after the EA, which generally won’t significantly affect the options price, unlike an “action” stock, which experience great price moves post-EA. With these symbols, if you’re on the right side of the price move, that’s a great thing. But if you’re on the wrong side of the move, not so great. Consequently, by minimizing the effect of the post-EA price move, you have a much better chance to profit from the reduction in IV without it being ruined by a violent price move.

For this trade, open the position either (1) the night before the EA when the company announces earnings or (2) during the EA day when it announces post-market, generally capturing IV at or close to its peak.

For this trade, open the position either (1) the night before the EA when the company announces earnings or (2) during the EA day when it announces post-market, generally capturing IV at or close to its peak.

This popular stockearnings screen will give you a list of stocks which do not react more than 4% fpost-EA. It includes only those stocks whose earnings are releasing next day.

Screen criteria:

  1. Earnings Date Start Date : Current Date + 1
  2. Earnings Date End Date : Current Date + 1
  3. Predicted Move (Next Day) Max : 4%
  4. Options Type: Weekly

Strategy Guideline:

  1. Options Strategy: Sell Call and Put
  2. Options Strike Price: Current Stock Price – (% Predicated Move x 2)
  3. Expiration Date: It should generally be the closest expiry immediately after the EA.
  4. Buy Insurance: Buying back Call and Put at Strike price which 10% lower than Sell Strike Price is optional but recommended.

Watch Video for More Detail

Volatility Rush Strategy - Best for Options Traders

The Volatility Rush takes advantage of increasing options premiums into earnings announcements (EA) caused by an anticipated rise in Implied Volatility (IV). With this strategy, Buy a Call and Put at-the-money (a long straddle) 2-3 weeks before the EA when IV is lower. Sell the position either (1) the night before the EA when the company announces earnings pre-market, or (2) during the EA day when it announces post-market, generally capturing IV at or close to its peak.

This popular screen will give you a list of stocks whose Options premiums tend to rise into Earnings. It includes only those stocks whose Earnings are at least two weeks away from today.

Screen criteria:

  1. Earnings Date Start Date : Current Date + 15 Days
  2. Earnings Date End Date : Current Date + 30 Days
  3. Predicted Move (Next Day) Min : 5%
  4. Options Type: Weekly or Monthly if that lines up with the two to three-week lead-time for entering the trade

Strategy Guideline:

  1. Buy a Straddle at or close to the money two to three weeks pre-EA.
  2. Sell the position either the night before the EA when the company announces earnings pre-market, or during the EA day when it announces post-market.
  3. Expiration date should generally be the closest expiry immediately after the EA.
  4. Straddle price should not be more 60% of predicted move.

Predicted Move (Volatility)

Similar to Implied Volatility in Options. Expected volatility % based on our Proprietary Volatility Predication Model. We are expecting that stock price will likely to reach % in either direction by the end of next trading session after Earnings are released and not necessarily the closing volatility %.

Why is it important?

    This indicator helps

  1. Knowing expected volatility in stocks after Earnings helps to decide trading stocks before Earnings Announcement.
  2. Taking Advantage of volatility collapse following Earnings Results by using Advance Options strategies such as Spread and Straddles.

Since Last Earnings

Change in share price since last Earnings release.

Why is it Important?

When share has gained more than 10% since it's last Earning release, it tends to over react to minor bad news and give up some gains if not all. So, it contains more downside volatility than upside When share has dropped more than 10% since it's last Earning release, it tends to over react to minor good news and recover some drops if not all. So, it contains more upside volatility than downside.

EPS Surprise (%)

Occurs when a company's reported quarterly or annual profits are above or below analysts' expectations. Here is the formula to derive % EPS Surprice:

Actual EPS - Estimated EPS
------------------------------------- x 100
Estimated EPS

Why is it Important?

Earnings surprises can have a huge impact on a company's stock price. Several studies suggest that positive earnings surprises not only lead to an immediate hike in a stock's price, but also to a gradual increase over time. Hence, it's not surprising that some companies are known for routinely beating earning projections. A negative earnings surprise will usually result in a decline in share price.

Next Day Price Change (%)

Next Regular trading session Closing price following Earnings result.

For After Market Close Earnings, It is a next trading day closing price. For Before Market Open Earnings, It is the same trading day closing price.

Why is it Important?

Next Day price change is a reaction of Earnings result.

Dell Explodes Higher as AI Server Demand Drives Record Q2 2027 Results

Posted on Sep 02, 2026 by Ian Cooper

Dell Explodes Higher as AI Server Demand Drives Record Q2 2027 Results

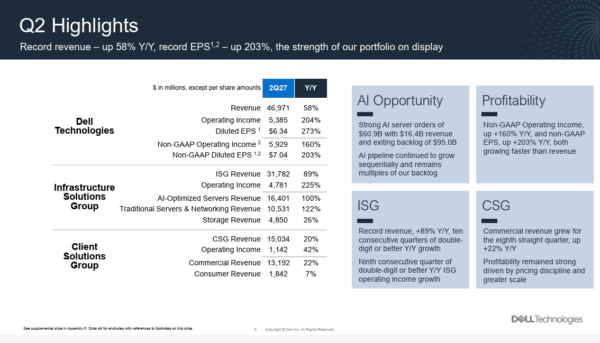
Dell Technologies (NYSE: DELL) is rocketing higher after the tech giant reported fiscal second-quarter results that significantly exceeded Wall Street expectations and raised its outlook for the year. The company reported adjusted earnings per share of $7.04, compared with the $4.92 expected. Revenue reached $46.97 billion, topping the $44.92 billion estimate.

Net income climbed to $4.13 billion, or $6.34 per share, from $1.16 billion, or $1.70 per share, in the same period a year earlier. The company also delivered a stronger-than-expected forecast for the current quarter. For its fiscal third quarter, the company expects adjusted earnings of $6.50 per share on revenue of approximately $49 billion.

That revenue forecast represents roughly 81% growth and is well above the $41.42 billion expected by analysts. Analysts had been forecasting adjusted earnings of $4.49 per share.

The company also raised its full-year outlook. Dell now expects $25.50 in adjusted earnings per share and $192 billion in revenue, compared with Wall Street estimates of $18.92 per share and $172.67 billion in revenue.

The guidance marks a sharp increase from the company’s outlook earlier in the year. 

In May, the company had projected $17.90 in adjusted earnings per share and revenue of between $165 billion and $169 billion.  COO Jeff Clarke said on a call with analysts that rising input costs and resulting price increases are contributing to the higher revenue forecast.
dell - StockEarnings

Dell’s PC Business Shows Signs of Weakness


However, the company’s PC business delivered a more mixed performance.

Its Client Solutions Group, which sells personal computers and accessories to consumers and commercial customers, reported $15.03 billion in revenue, up 20% year over year but slightly below the $15.08 billion expected.

Clarke said Dell had seen signs earlier in the year that the PC market could weaken during the second half. As a result, the company shifted resources and products toward its infrastructure business. The strategy reflects Dell’s broader transformation from a traditional PC maker into a major supplier of data center and AI infrastructure.

Dell Wins Billions in AI and Government Contracts

Dell’s growing AI infrastructure business has been supported by major contracts and partnerships. During the quarter, the company received a $9.7 billion contract to provide software to the U.S. military. AI-focused cloud infrastructure provider Iren also agreed to purchase $1.6 billion worth of Dell hardware, including servers equipped with Nvidia chips.

Even better, the stock has become a popular way for investors to participate in the continued expansion of AI infrastructure.

Dell Stock Technical Analysis: Premarket Surge Reclaims Momentum

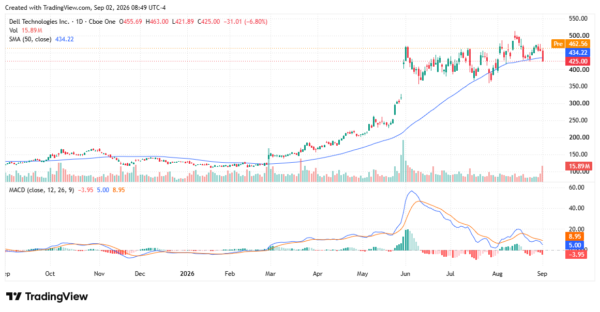
Dell stock is entering the regular trading session with a significant technical catalyst that is not reflected in the daily chart. Shares closed the prior session at $425, down 6.8%, but were trading as high as roughly $462.50 in premarket trading, a gain of about 8.8% from that close. That puts the stock back above its 50-day simple moving average at $434.22 and changes the significance of the prior-session sell-off.

The first technical question is whether DELL can hold the $434 area after the market opens. The 50-day moving average had been trending higher and served as an important indicator of the stock’s intermediate-term uptrend. A premarket move back above that level is encouraging, but the more meaningful signal will come if buyers can keep the stock above it during regular trading.

The premarket price near $462.50 also puts the stock back into the middle of the trading range that has developed since June. The stock has repeatedly encountered resistance in the $475- $500 range, with $500 as the most important psychological barrier. If the earnings-driven rally can push through $475 and eventually reclaim $500, the chart would become considerably more bullish and could signal a resumption of the powerful uptrend that began earlier this year.

There is still a momentum question to resolve. The MACD had turned bearish on the chart, with the MACD line around 5.00 below the signal line near 8.95 and a negative histogram. That reflected the weakness visible at the prior close. However, technical indicators based on daily closing prices will not immediately capture the significance of a sharp premarket earnings reaction. If the stock holds its premarket gains and closes substantially higher during Wednesday’s session, the MACD could begin to turn higher in subsequent sessions.

Volume will be particularly important. A large earnings-related move accompanied by heavy regular-session volume would provide considerably more confirmation than a premarket spike that fades after the opening bell. Investors should therefore watch whether buyers continue to support the stock once normal trading begins.

The setup creates several important levels to watch. Around $434 is the first support level, because it represents the 50-day moving average. The $450-$462 area is the immediate zone created by the premarket move. Above that, $475 becomes the next important resistance area, followed by the psychologically significant $500 level. On the downside, a failure to hold $434 would suggest that the market is rejecting the initial earnings reaction and could put the $400 area back into focus.

For now, the premarket action significantly improves the technical picture. Rather than entering the regular session with DELL sitting below its 50-day moving average after a 6.8% decline, investors are looking at a stock that has potentially reclaimed that key trend indicator before the opening bell.

The important distinction is that a premarket gain is not yet a confirmed breakout. If the stock can hold above $434 and challenge $475-$500 on strong volume, the earnings reaction could mark the beginning of another leg higher. If the premarket gains evaporate quickly, however, investors will want to see whether the 50-day moving average can still provide support.

This gives the stock a particularly interesting technical setup: the fundamentals have produced a powerful premarket reversal, and the regular session will determine whether that reversal becomes a genuine technical breakout.
dell - StockEarnings

What’s Next for Dell Stock After Earnings?

The results also further boosted the fortunes of Dell founder, chairman and CEO Michael Dell, who is now the world’s fifth-richest person, according to Bloomberg. After the results were released, Dell posted on X: “There’s an old Texas saying I may have just made up… If you keep growing EPS 200%+ y/y something good will happen.”

For Dell Technologies, the latest quarter suggests that something very good is happening. With AI server demand accelerating, major customers committing billions of dollars to infrastructure, and the company raising its forecasts, Dell is increasingly positioned as a major beneficiary of the AI spending boom.


Over the last 26 years, he’s taught thousands of investors how to trade news flow and herd mentality using a unique blend of technical and fundamental analysis. Cooper was among the few analysts to spot the financial crisis of 2008, the top of subprime and Alt-A, the death of Lehman Brothers, Bear Stearns, and New Century Financial, and even the Dow’s collapse to 6,500, as well as its recovery. He even called for gold to rally well above $1.500 when it traded under $600. At the moment, Cooper makes use of technical, fundamental and news analysis, to help individual investors grow their wealth. He’s a firm believer that hard work and thorough research will lead to investment success.

Join over 1.2M+ investors/traders who receive daily and weekly notable earnings alerts with predicted move