ajax loader

Loading...


Ride-the-Wave Strategy – Best for Stock Traders

Ride-the-Wave targets multi-day price momentum following a company’s earnings announcement (EA). With this strategy:

  1. Buy a stock one day post-EA if a stock reacts positively post-earnings:
    1. Near the close of trading the EA-day for a pre-market-EA
    2. Near the close of the following day for a post-market-EA
  2. Sell-to-close after 7-10 days, or possibly earlier if a desired price target is reached

Similarly,

  1. short a stock one day post-EA if a stock reacts negatively post-earnings:
    1. near the close of trading the EA-day for a premarket-EA
    2. near the close of the following day for a post-market-EA
  2. then buy-to-close after 7-10 days, or possibly earlier if a desired price target is reached

Important: Ride-the-Wave is predicated on significant price momentum triggered by an EA. The 7-10 day scenario is the maximum trade hold-time. If you see post EA-momentum is halted or reversed by a significant opposite move, re-evaluate your presence in the trade.

This popular StockEarnings screen below will give you a list of stocks that historically exhibit significant price momentum following an EA for the next seven days:

  1. Stocks exhibiting positive post-EA price moves are buy-candidates
  2. Stocks exhibiting negative post-EA price moves are sell/short-candidates

The screen includes those stocks whose Earnings just came out in last two days.

Screen criteria:

  1. Earnings Date Start Date : Current Date + -1 Day
  2. Earnings Date End Date : Current Date + -2 Days
  3. Predicted Move (Next Day) Max : 7%
  4. Predicted Move (On 7th Day) Min : 7%

Strategy Guideline:

  1. Buy the stock if stock has reacted positively. Short the stock if stock has reacted negatively (see above).
  2. Close the position in 7-10 days, or possibly earlier based on price move.

Volatility Crush Strategy - Best for Options Traders

The Volatility Crush strategy is used with stocks that typically experience relatively low-to-moderate price moves (≤4%) following their Earnings Announcements (EA). The basic trade idea is to sell put or call options right before the EA, collecting a credit when options premium is very high due to elevated implied volatility (IV). You then close the position right after the EA by buying the option back much cheaper due to the significant drop in IV that occurs after the mystery of the EA disappears. In assessing this trade, you need to do your homework to ensure you collect sufficient premium to make the trade worthwhile.

This trade is practical due to the low-to-moderate price-move after the EA, which generally won’t significantly affect the options price, unlike an “action” stock, which experience great price moves post-EA. With these symbols, if you’re on the right side of the price move, that’s a great thing. But if you’re on the wrong side of the move, not so great. Consequently, by minimizing the effect of the post-EA price move, you have a much better chance to profit from the reduction in IV without it being ruined by a violent price move.

For this trade, open the position either (1) the night before the EA when the company announces earnings or (2) during the EA day when it announces post-market, generally capturing IV at or close to its peak.

For this trade, open the position either (1) the night before the EA when the company announces earnings or (2) during the EA day when it announces post-market, generally capturing IV at or close to its peak.

This popular stockearnings screen will give you a list of stocks which do not react more than 4% fpost-EA. It includes only those stocks whose earnings are releasing next day.

Screen criteria:

  1. Earnings Date Start Date : Current Date + 1
  2. Earnings Date End Date : Current Date + 1
  3. Predicted Move (Next Day) Max : 4%
  4. Options Type: Weekly

Strategy Guideline:

  1. Options Strategy: Sell Call and Put
  2. Options Strike Price: Current Stock Price – (% Predicated Move x 2)
  3. Expiration Date: It should generally be the closest expiry immediately after the EA.
  4. Buy Insurance: Buying back Call and Put at Strike price which 10% lower than Sell Strike Price is optional but recommended.

Watch Video for More Detail

Volatility Rush Strategy - Best for Options Traders

The Volatility Rush takes advantage of increasing options premiums into earnings announcements (EA) caused by an anticipated rise in Implied Volatility (IV). With this strategy, Buy a Call and Put at-the-money (a long straddle) 2-3 weeks before the EA when IV is lower. Sell the position either (1) the night before the EA when the company announces earnings pre-market, or (2) during the EA day when it announces post-market, generally capturing IV at or close to its peak.

This popular screen will give you a list of stocks whose Options premiums tend to rise into Earnings. It includes only those stocks whose Earnings are at least two weeks away from today.

Screen criteria:

  1. Earnings Date Start Date : Current Date + 15 Days
  2. Earnings Date End Date : Current Date + 30 Days
  3. Predicted Move (Next Day) Min : 5%
  4. Options Type: Weekly or Monthly if that lines up with the two to three-week lead-time for entering the trade

Strategy Guideline:

  1. Buy a Straddle at or close to the money two to three weeks pre-EA.
  2. Sell the position either the night before the EA when the company announces earnings pre-market, or during the EA day when it announces post-market.
  3. Expiration date should generally be the closest expiry immediately after the EA.
  4. Straddle price should not be more 60% of predicted move.

Predicted Move (Volatility)

Similar to Implied Volatility in Options. Expected volatility % based on our Proprietary Volatility Predication Model. We are expecting that stock price will likely to reach % in either direction by the end of next trading session after Earnings are released and not necessarily the closing volatility %.

Why is it important?

    This indicator helps

  1. Knowing expected volatility in stocks after Earnings helps to decide trading stocks before Earnings Announcement.
  2. Taking Advantage of volatility collapse following Earnings Results by using Advance Options strategies such as Spread and Straddles.

Since Last Earnings

Change in share price since last Earnings release.

Why is it Important?

When share has gained more than 10% since it's last Earning release, it tends to over react to minor bad news and give up some gains if not all. So, it contains more downside volatility than upside When share has dropped more than 10% since it's last Earning release, it tends to over react to minor good news and recover some drops if not all. So, it contains more upside volatility than downside.

EPS Surprise (%)

Occurs when a company's reported quarterly or annual profits are above or below analysts' expectations. Here is the formula to derive % EPS Surprice:

Actual EPS - Estimated EPS
------------------------------------- x 100
Estimated EPS

Why is it Important?

Earnings surprises can have a huge impact on a company's stock price. Several studies suggest that positive earnings surprises not only lead to an immediate hike in a stock's price, but also to a gradual increase over time. Hence, it's not surprising that some companies are known for routinely beating earning projections. A negative earnings surprise will usually result in a decline in share price.

Next Day Price Change (%)

Next Regular trading session Closing price following Earnings result.

For After Market Close Earnings, It is a next trading day closing price. For Before Market Open Earnings, It is the same trading day closing price.

Why is it Important?

Next Day price change is a reaction of Earnings result.

Why Hedge Funds Are Quietly Rotating Into Industrials

Posted on Jul 10, 2026 by Grayson Cavern

Why Hedge Funds Are Quietly Rotating Into Industrials

The rotation has been happening in plain sight, and most retail investors have missed it entirely because their attention has been fixed on the same AI hardware names that drove the last two years of outperformance. Hedge funds entered 2026 overweight industrials by more than 7.34 percentage points relative to the Russell 3000 – a record, according to Goldman Sachs – making industrials the single most crowded institutional trade heading into this year, at a moment when most individual investors were still debating which semiconductor stock to buy next.

Now that positioning didn’t happen by accident, and it didn’t happen because fund managers suddenly fell in love with boring cash flows. It happened because the most sophisticated capital allocators in the world figured something out before the broader market did: the AI trade that rewarded chip companies and cloud providers for the first two years is now generating a second, larger wave of demand that flows directly into the physical world – into electrical equipment, power generation, cooling infrastructure, and the industrial machinery required to build and run everything AI depends on. 

Put another way, the first trade was about the intelligence. And the second trade is about the infrastructure that makes the intelligence possible.

Goldman Didn’t Just Spot A Rotation. It Explained Why.


Goldman Sachs’ Prime Brokerage data showed hedge funds rotating aggressively into cyclical sectors through late 2025 and into 2026, with industrials absorbing the largest share of institutional buying. Trading activity across the sector climbed to five-year highs globally as money concentrated in electrical equipment, machinery, commercial services, aerospace and defense, and airlines… the parts of the industrial economy positioned to benefit most directly from AI infrastructure spending and rising defense budgets. 

What makes this rotation structurally different from a typical cyclical trade is the thesis driving it. Coatue Management’s own industrials analyst, Max Cook, described the logic that led the firm to pivot its entire sector coverage: if AI drives a massive data center buildout, that buildout requires industrial equipment – often made by the same companies his team had originally been analyzing as potential shorts. That realization, replicated across dozens of major hedge funds, is what produced 7.34 percentage points of overweight positioning before most retail investors noticed anything had changed.

Three Stocks Explain The Entire Rotation

The individual holdings tell the story better than any sector allocation can.

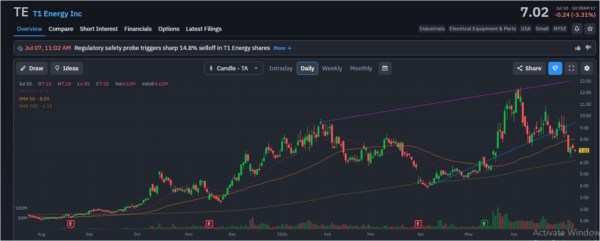
T1 Energy Inc (NYSE: TE) became the most aggressively accumulated industrial stock, with 36 hedge funds increasing positions during the fourth quarter alone. The company followed that institutional interest with first-quarter net sales of $177.6 million, more than tripling the $53.5 million reported a year earlier. Situational Awareness LP disclosed a new 10 million-share position, while BlackRock increased its stake by 42%, adding another 4.55 million shares. 
hedge funds-StockEarnings

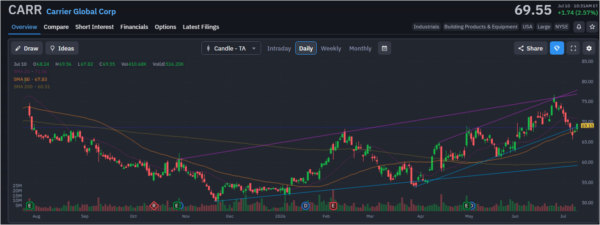
Carrier Global Corp (NYSE: CARR) attracted 33 hedge funds, making it the second-most accumulated industrial stock. And that makes complete sense when you understand that every AI data center generates heat that has to go somewhere, and Carrier’s HVAC and cooling systems sit directly inside that problem. AI density per rack keeps increasing, which means cooling requirements per facility keep increasing with it, compounding Carrier’s addressable market without requiring any new product category to be invented. 
hedge funds-StockEarnings

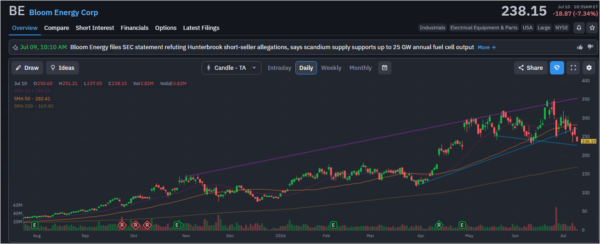
Then there’s Bloom Energy (BE), which may be the clearest validation of the entire theme. Revenue surged 130% year over year to $751.1 million, adjusted EBITDA climbed from $25.2 million to $143 million, and management raised full-year revenue guidance to $3.4-$3.8 billion. Just days later, Brookfield Asset Management expanded its AI factory partnership with Bloom from $5 billion to $25 billion, a move that effectively validated on-site power generation as a critical piece of AI infrastructure rather than a niche opportunity. 
hedge funds-StockEarnings

Notice what connects all three companies? 

None of them build GPUs, or train language models, or sell AI software. Instead, they’re solving the physical constraints AI keeps creating.

Why This Rotation Has Room To Run

There’s a phrase hedge funds have reportedly been using internally: “atoms over bits.” I think it captures this rotation perfectly.  For the first two years, AI rewarded companies selling bits like chips, software and computing power.

Now institutions appear focused on the atoms: power infrastructure, cooling systems, industrial automation and the manufacturing capacity needed to keep AI expanding.

Goldman recently noted that hedge funds are actively searching for second and third-order AI beneficiaries. That is, the less crowded positions in power infrastructure, thermal management, industrial automation, and chip supply chain adjacencies… because the obvious first-order trades have become increasingly crowded and expensive. 

The positioning data and the stock performance are telling the same story from different angles. When 36 hedge funds are piling into an energy equipment manufacturer in a single quarter, and Bloom Energy is up 1,000% over twelve months while Brookfield expands a $5 billion commitment to $25 billion in the same period, the rotation isn’t quiet anymore. It’s the loudest signal in the market – the kind that tends to look obvious in hindsight and unbelievable in real time. 

The funds that understood the AI buildout required physical infrastructure moved first. The stocks reflect that. The question now is whether the market has fully priced the duration of the opportunity, and based on the scale of committed capital flowing through names like Bloom and Carrier, the answer appears to be no. 

Join over 1.2M+ investors/traders who receive daily and weekly notable earnings alerts with predicted move
