ajax loader

Loading...


Ride-the-Wave Strategy – Best for Stock Traders

Ride-the-Wave targets multi-day price momentum following a company’s earnings announcement (EA). With this strategy:

  1. Buy a stock one day post-EA if a stock reacts positively post-earnings:
    1. Near the close of trading the EA-day for a pre-market-EA
    2. Near the close of the following day for a post-market-EA
  2. Sell-to-close after 7-10 days, or possibly earlier if a desired price target is reached

Similarly,

  1. short a stock one day post-EA if a stock reacts negatively post-earnings:
    1. near the close of trading the EA-day for a premarket-EA
    2. near the close of the following day for a post-market-EA
  2. then buy-to-close after 7-10 days, or possibly earlier if a desired price target is reached

Important: Ride-the-Wave is predicated on significant price momentum triggered by an EA. The 7-10 day scenario is the maximum trade hold-time. If you see post EA-momentum is halted or reversed by a significant opposite move, re-evaluate your presence in the trade.

This popular StockEarnings screen below will give you a list of stocks that historically exhibit significant price momentum following an EA for the next seven days:

  1. Stocks exhibiting positive post-EA price moves are buy-candidates
  2. Stocks exhibiting negative post-EA price moves are sell/short-candidates

The screen includes those stocks whose Earnings just came out in last two days.

Screen criteria:

  1. Earnings Date Start Date : Current Date + -1 Day
  2. Earnings Date End Date : Current Date + -2 Days
  3. Predicted Move (Next Day) Max : 7%
  4. Predicted Move (On 7th Day) Min : 7%

Strategy Guideline:

  1. Buy the stock if stock has reacted positively. Short the stock if stock has reacted negatively (see above).
  2. Close the position in 7-10 days, or possibly earlier based on price move.

Volatility Crush Strategy - Best for Options Traders

The Volatility Crush strategy is used with stocks that typically experience relatively low-to-moderate price moves (≤4%) following their Earnings Announcements (EA). The basic trade idea is to sell put or call options right before the EA, collecting a credit when options premium is very high due to elevated implied volatility (IV). You then close the position right after the EA by buying the option back much cheaper due to the significant drop in IV that occurs after the mystery of the EA disappears. In assessing this trade, you need to do your homework to ensure you collect sufficient premium to make the trade worthwhile.

This trade is practical due to the low-to-moderate price-move after the EA, which generally won’t significantly affect the options price, unlike an “action” stock, which experience great price moves post-EA. With these symbols, if you’re on the right side of the price move, that’s a great thing. But if you’re on the wrong side of the move, not so great. Consequently, by minimizing the effect of the post-EA price move, you have a much better chance to profit from the reduction in IV without it being ruined by a violent price move.

For this trade, open the position either (1) the night before the EA when the company announces earnings or (2) during the EA day when it announces post-market, generally capturing IV at or close to its peak.

For this trade, open the position either (1) the night before the EA when the company announces earnings or (2) during the EA day when it announces post-market, generally capturing IV at or close to its peak.

This popular stockearnings screen will give you a list of stocks which do not react more than 4% fpost-EA. It includes only those stocks whose earnings are releasing next day.

Screen criteria:

  1. Earnings Date Start Date : Current Date + 1
  2. Earnings Date End Date : Current Date + 1
  3. Predicted Move (Next Day) Max : 4%
  4. Options Type: Weekly

Strategy Guideline:

  1. Options Strategy: Sell Call and Put
  2. Options Strike Price: Current Stock Price – (% Predicated Move x 2)
  3. Expiration Date: It should generally be the closest expiry immediately after the EA.
  4. Buy Insurance: Buying back Call and Put at Strike price which 10% lower than Sell Strike Price is optional but recommended.

Watch Video for More Detail

Volatility Rush Strategy - Best for Options Traders

The Volatility Rush takes advantage of increasing options premiums into earnings announcements (EA) caused by an anticipated rise in Implied Volatility (IV). With this strategy, Buy a Call and Put at-the-money (a long straddle) 2-3 weeks before the EA when IV is lower. Sell the position either (1) the night before the EA when the company announces earnings pre-market, or (2) during the EA day when it announces post-market, generally capturing IV at or close to its peak.

This popular screen will give you a list of stocks whose Options premiums tend to rise into Earnings. It includes only those stocks whose Earnings are at least two weeks away from today.

Screen criteria:

  1. Earnings Date Start Date : Current Date + 15 Days
  2. Earnings Date End Date : Current Date + 30 Days
  3. Predicted Move (Next Day) Min : 5%
  4. Options Type: Weekly or Monthly if that lines up with the two to three-week lead-time for entering the trade

Strategy Guideline:

  1. Buy a Straddle at or close to the money two to three weeks pre-EA.
  2. Sell the position either the night before the EA when the company announces earnings pre-market, or during the EA day when it announces post-market.
  3. Expiration date should generally be the closest expiry immediately after the EA.
  4. Straddle price should not be more 60% of predicted move.

Predicted Move (Volatility)

Similar to Implied Volatility in Options. Expected volatility % based on our Proprietary Volatility Predication Model. We are expecting that stock price will likely to reach % in either direction by the end of next trading session after Earnings are released and not necessarily the closing volatility %.

Why is it important?

    This indicator helps

  1. Knowing expected volatility in stocks after Earnings helps to decide trading stocks before Earnings Announcement.
  2. Taking Advantage of volatility collapse following Earnings Results by using Advance Options strategies such as Spread and Straddles.

Since Last Earnings

Change in share price since last Earnings release.

Why is it Important?

When share has gained more than 10% since it's last Earning release, it tends to over react to minor bad news and give up some gains if not all. So, it contains more downside volatility than upside When share has dropped more than 10% since it's last Earning release, it tends to over react to minor good news and recover some drops if not all. So, it contains more upside volatility than downside.

EPS Surprise (%)

Occurs when a company's reported quarterly or annual profits are above or below analysts' expectations. Here is the formula to derive % EPS Surprice:

Actual EPS - Estimated EPS
------------------------------------- x 100
Estimated EPS

Why is it Important?

Earnings surprises can have a huge impact on a company's stock price. Several studies suggest that positive earnings surprises not only lead to an immediate hike in a stock's price, but also to a gradual increase over time. Hence, it's not surprising that some companies are known for routinely beating earning projections. A negative earnings surprise will usually result in a decline in share price.

Next Day Price Change (%)

Next Regular trading session Closing price following Earnings result.

For After Market Close Earnings, It is a next trading day closing price. For Before Market Open Earnings, It is the same trading day closing price.

Why is it Important?

Next Day price change is a reaction of Earnings result.

Domino’s Pizza Delivered A “FAKE” Weak Quarter 1 Earnings

Posted on Apr 27, 2026 by Grayson Cavern

Domino’s Pizza Delivered A “FAKE” Weak Quarter 1 Earnings

Domino’s Pizza (NASDAQ: DPZ) walked into this quarter with the market already positioned for cracks. The consumer is slowing, everyday spending is softening, and anything sitting in the middle of that crossfire is supposed to show it. Then the numbers from Q1 2026 earnings reports landed: $1.121 billion in revenue, up 3.5% year-over-year, and diluted EPS of $4.13, down from $4.33, and most people stopped reading right there, which is precisely why most people drew the wrong conclusion.

Soft Demand Was Never The Actual Story


Same-store sales came in at +0.9% in the U.S. and -0.4% internationally, excluding currency effects, friction, not momentum, and there is no point dressing it up as anything else.

The consumer is hesitating, and just like every other company, Domino’s Pizza is not immune to it, and acknowledging that is the starting point of an honest read. 

But acknowledging that demand is soft is not the same as concluding that the business is weakening, and conflating the two is the analytical error you can make this quarter. Sure enough, soft demand tells you what the environment looks like. At the same time, it says nothing about how a well-structured franchise system responds when its operating model is built specifically for moments like this.

The Number Everyone Skipped

Income from operations increased $20.3 million, or 9.6% year-over-year, and even after stripping out currency effects it still rose 7.9. Truth is, a business losing control of its model in a difficult demand environment simply does not produce that result. 

Even better, franchise royalties are rising (U.S franchise royalty and fees increased from $151,000 to $158,014 yoy, while its international segments surged from $75,559 to $80, 980), supply chain margins are expanding, and the system is extracting meaningfully more profit from essentially the same level of consumer demand it was working with a year ago. 

That is a company that has structurally reduced its dependence on volume growth to drive earnings expansion, and that distinction carries real valuation implications that the headline reaction ignored entirely.

The EPS Decline Had One Cause – And It Wasn’t The Business

Net income fell $9.8 million, or 6.6%, pulling EPS to $4.13 from $4.33, and the release tells you exactly what drove it: a $30.0 million unfavorable swing from the remeasurement of Domino’s investment in DPC Dash Ltd.. A non-cash, mark-to-market adjustment with no connection to pizza volumes, franchise royalty income, or supply chain efficiency. That is not the business you are buying when you buy Domino’s, and treating it as a signal about operational health is a category error. 

Yes, free cash flow declined to $147.0 million from $164.4 million, but that movement was also driven entirely by working capital timing rather than deterioration in the underlying cash engine. Both numbers that triggered the negative reaction were pulled lower by factors sitting completely outside the core franchise model, while that model itself grew nearly 10% in operating income. 

Holding both facts simultaneously is what separates a genuine read of this business from a reflexive response to the wrong lines, and you don’t want to be caught with the latter.

Smart Money Already Read Past The EPS Line

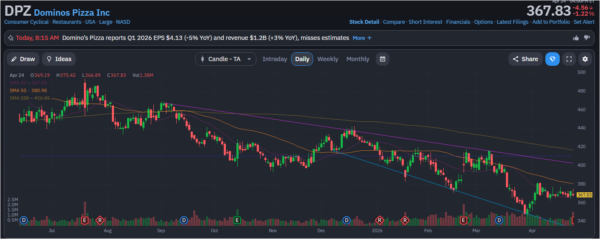
The chart tells the story that the headline numbers tried to distort. Domino’s Pizza was already in a controlled downtrend heading into earnings, drifting below its 50-day and 200-day moving averages with lower highs compressing expectations, so the “miss” was not a surprise event but something the market had largely leaned into. 

What matters is what happened after: the selloff lacked conviction, price stabilized quickly around the $360–$370 range, and volume did not expand aggressively on the downside, which is not how true structural weakness behaves. 

Instead of cascading lower, the stock absorbed the bad news and held its base, suggesting institutions were not rushing for the exit but quietly accepting the disconnect between weak optics and strengthening operations. That’s not fear but controlled positioning, and it aligns perfectly with a business that looks weaker on paper than it actually is underneath.
domino's - StockEarnings

Franchise Economics Don’t Crack Under Pressure

Although Domino’s has a global net stores growth of 180, including 19 new U.S stores and 161 international openings, the fast food veteran is not a fragile, traffic-dependent restaurant concept that requires a strong consumer backdrop to protect its margins. 

It is a scaled franchise system built on royalty income, supply chain leverage, and pricing discipline, designed to compound through cycles rather than despite them. 

When demand softens, that architecture doesn’t deteriorate the way a traditional operator does; it filters, leaning into its franchise network, controlling its cost structure, and continuing to generate earnings growth from operational efficiency rather than volume. The market priced this quarter like the former. The business performed like the latter, and that gap between perception and reality is where you want to be.

Optics Down, Operations Up – Pick The Right One

When a company’s core operating engine is genuinely deteriorating, declining earnings are the confirmation – you step back and reassess. 

But when the core engine is accelerating while reported earnings are distorted by a non-cash investment adjustment, that divergence is not a warning signal. It is a mispricing, and mispricing created by surface-level reading is the most reliable kind because it corrects the moment enough people do the work the market skipped. 

When those two things move in opposite directions with this much clarity, the opportunity almost always belongs to whoever refused to stop at the headline.


Join over 1.2M+ investors/traders who receive daily and weekly notable earnings alerts with predicted move